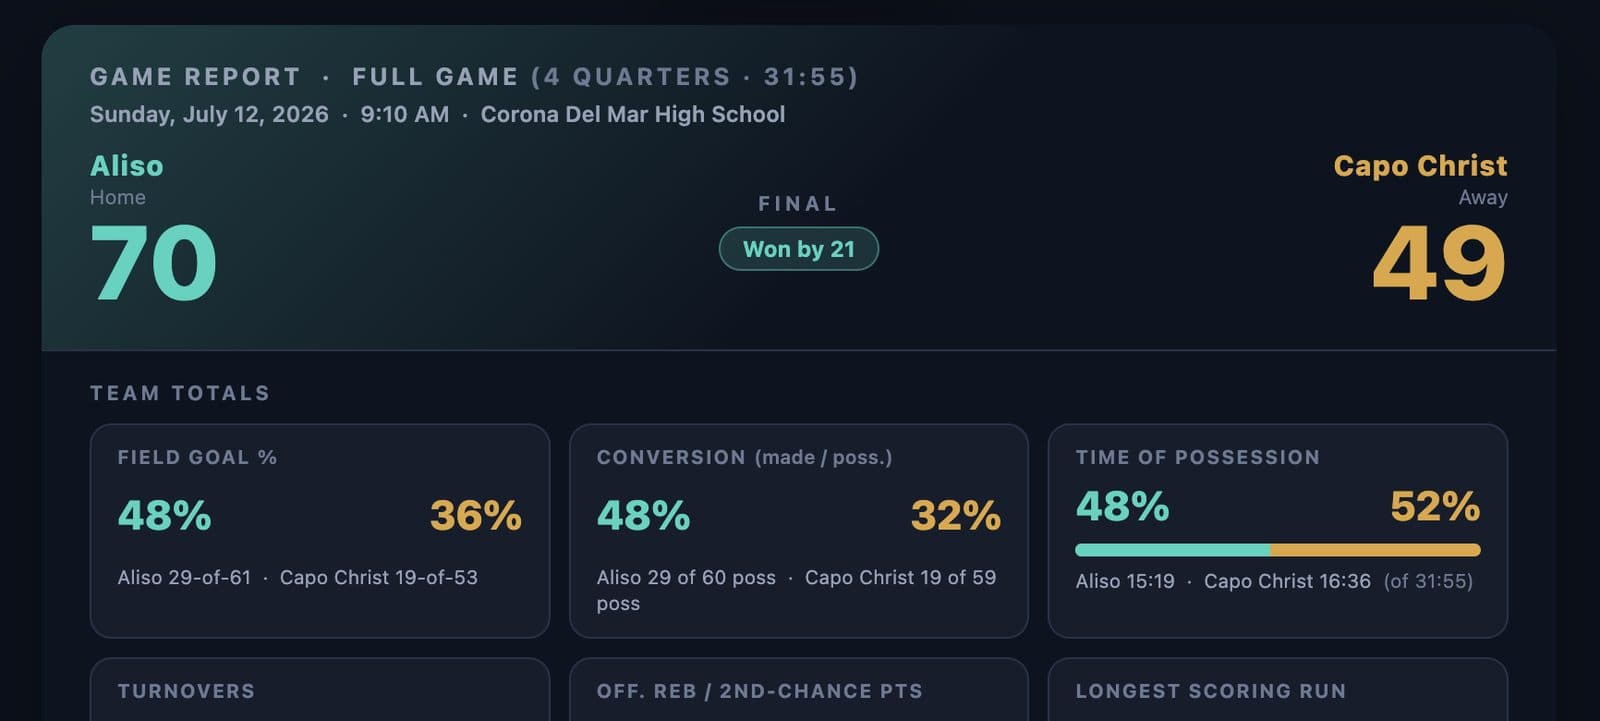
Last season, the coach of my son's JV basketball team asked if I could keep stats.
Sure. Pen, paper, clipboard.
The official scorebook already tracks points and fouls. The coach wanted the layer underneath — turnovers, rebounds, the dynamics that decide games but never get written down.
I'm not a basketball guy. I am a physics and data guy. So I said yes, and then spent a season learning why this is harder than it looks.
The paper era
I kept redesigning the sheet. Version after version, all season long.
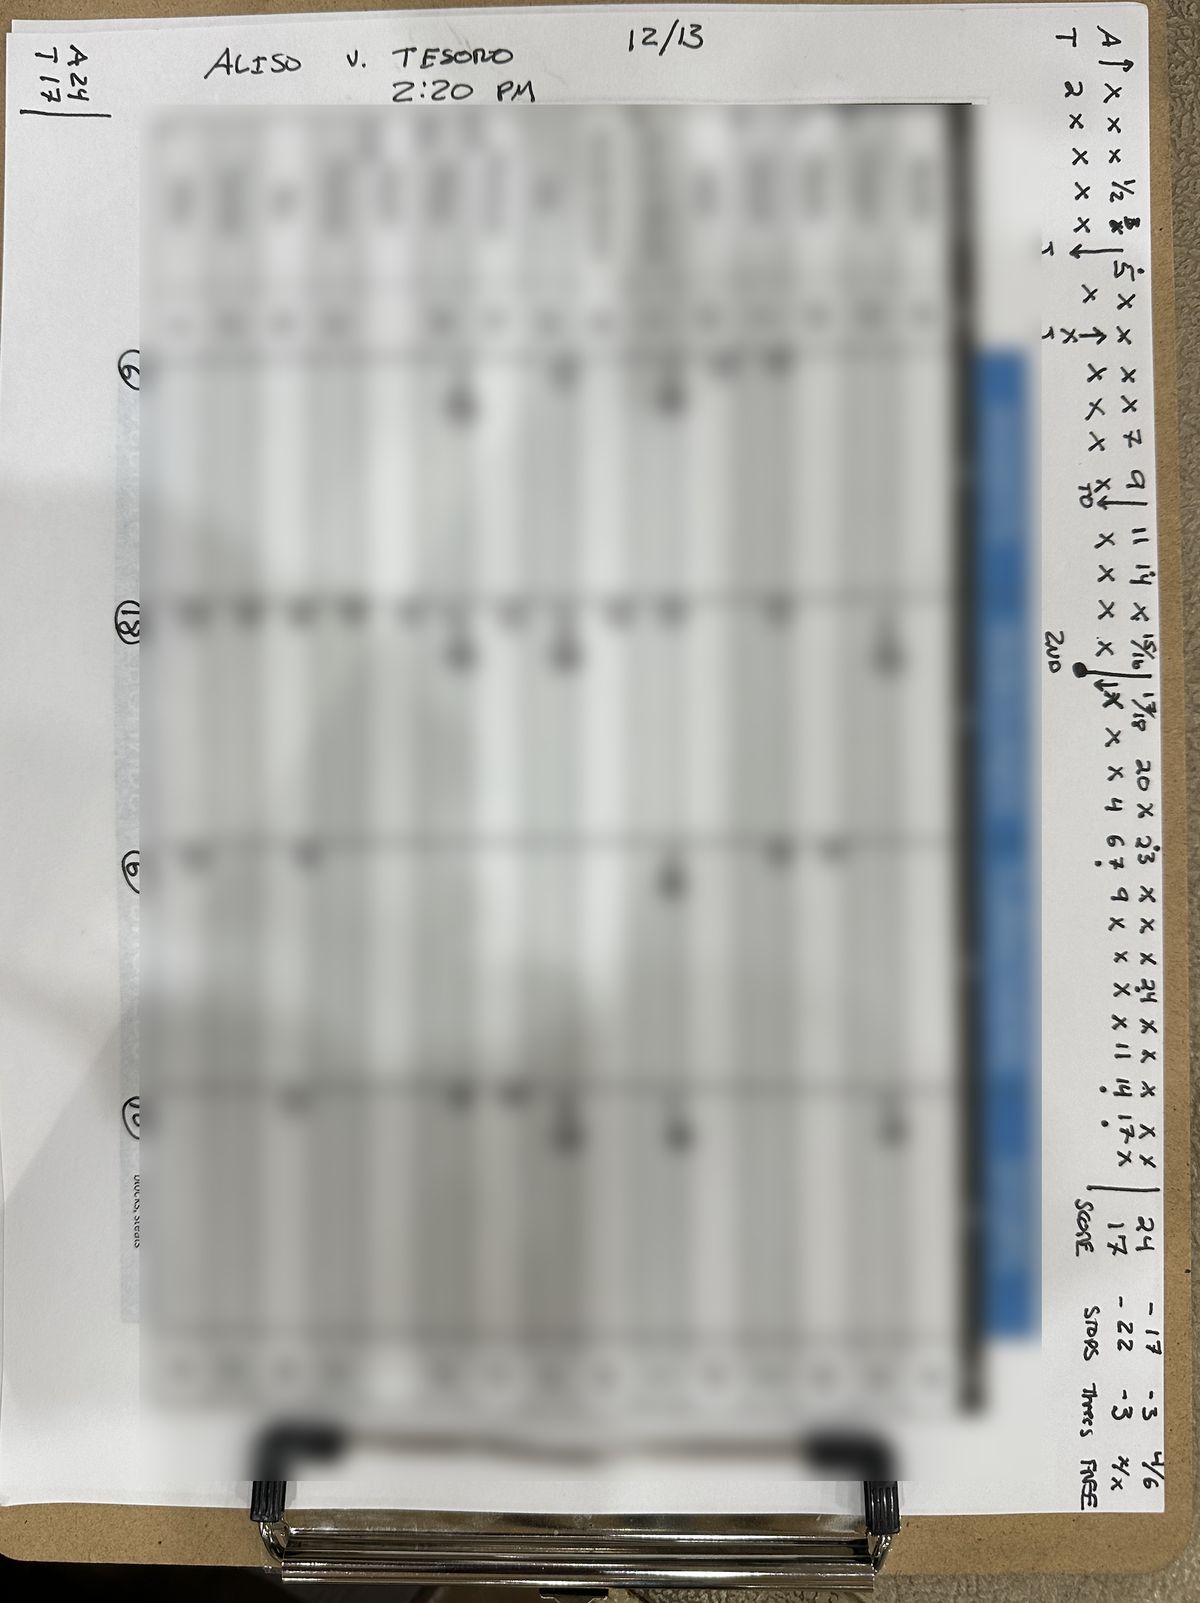
The best discovery didn't happen in the printed grid. It happened in the margin: I started scoring the game possession by possession, like innings in baseball or holes on a golf card.
Suddenly you could see the game's shape. Where a run started. Where turnovers bled points. Which stretches a team controlled and which they survived. Coaches live inside fouls and the score — they'd never seen a game laid out this way.
But paper had two problems, and they became the reason to build.
Problem one: capture
Keeping stats on a clipboard means taking your eyes off the game. Every glance down is a possession you half-saw. It felt unnatural and it was error-prone.
So I built a web app — with Lovable, published through Lovable — designed around one constraint: track everything with one hand while always watching the floor.
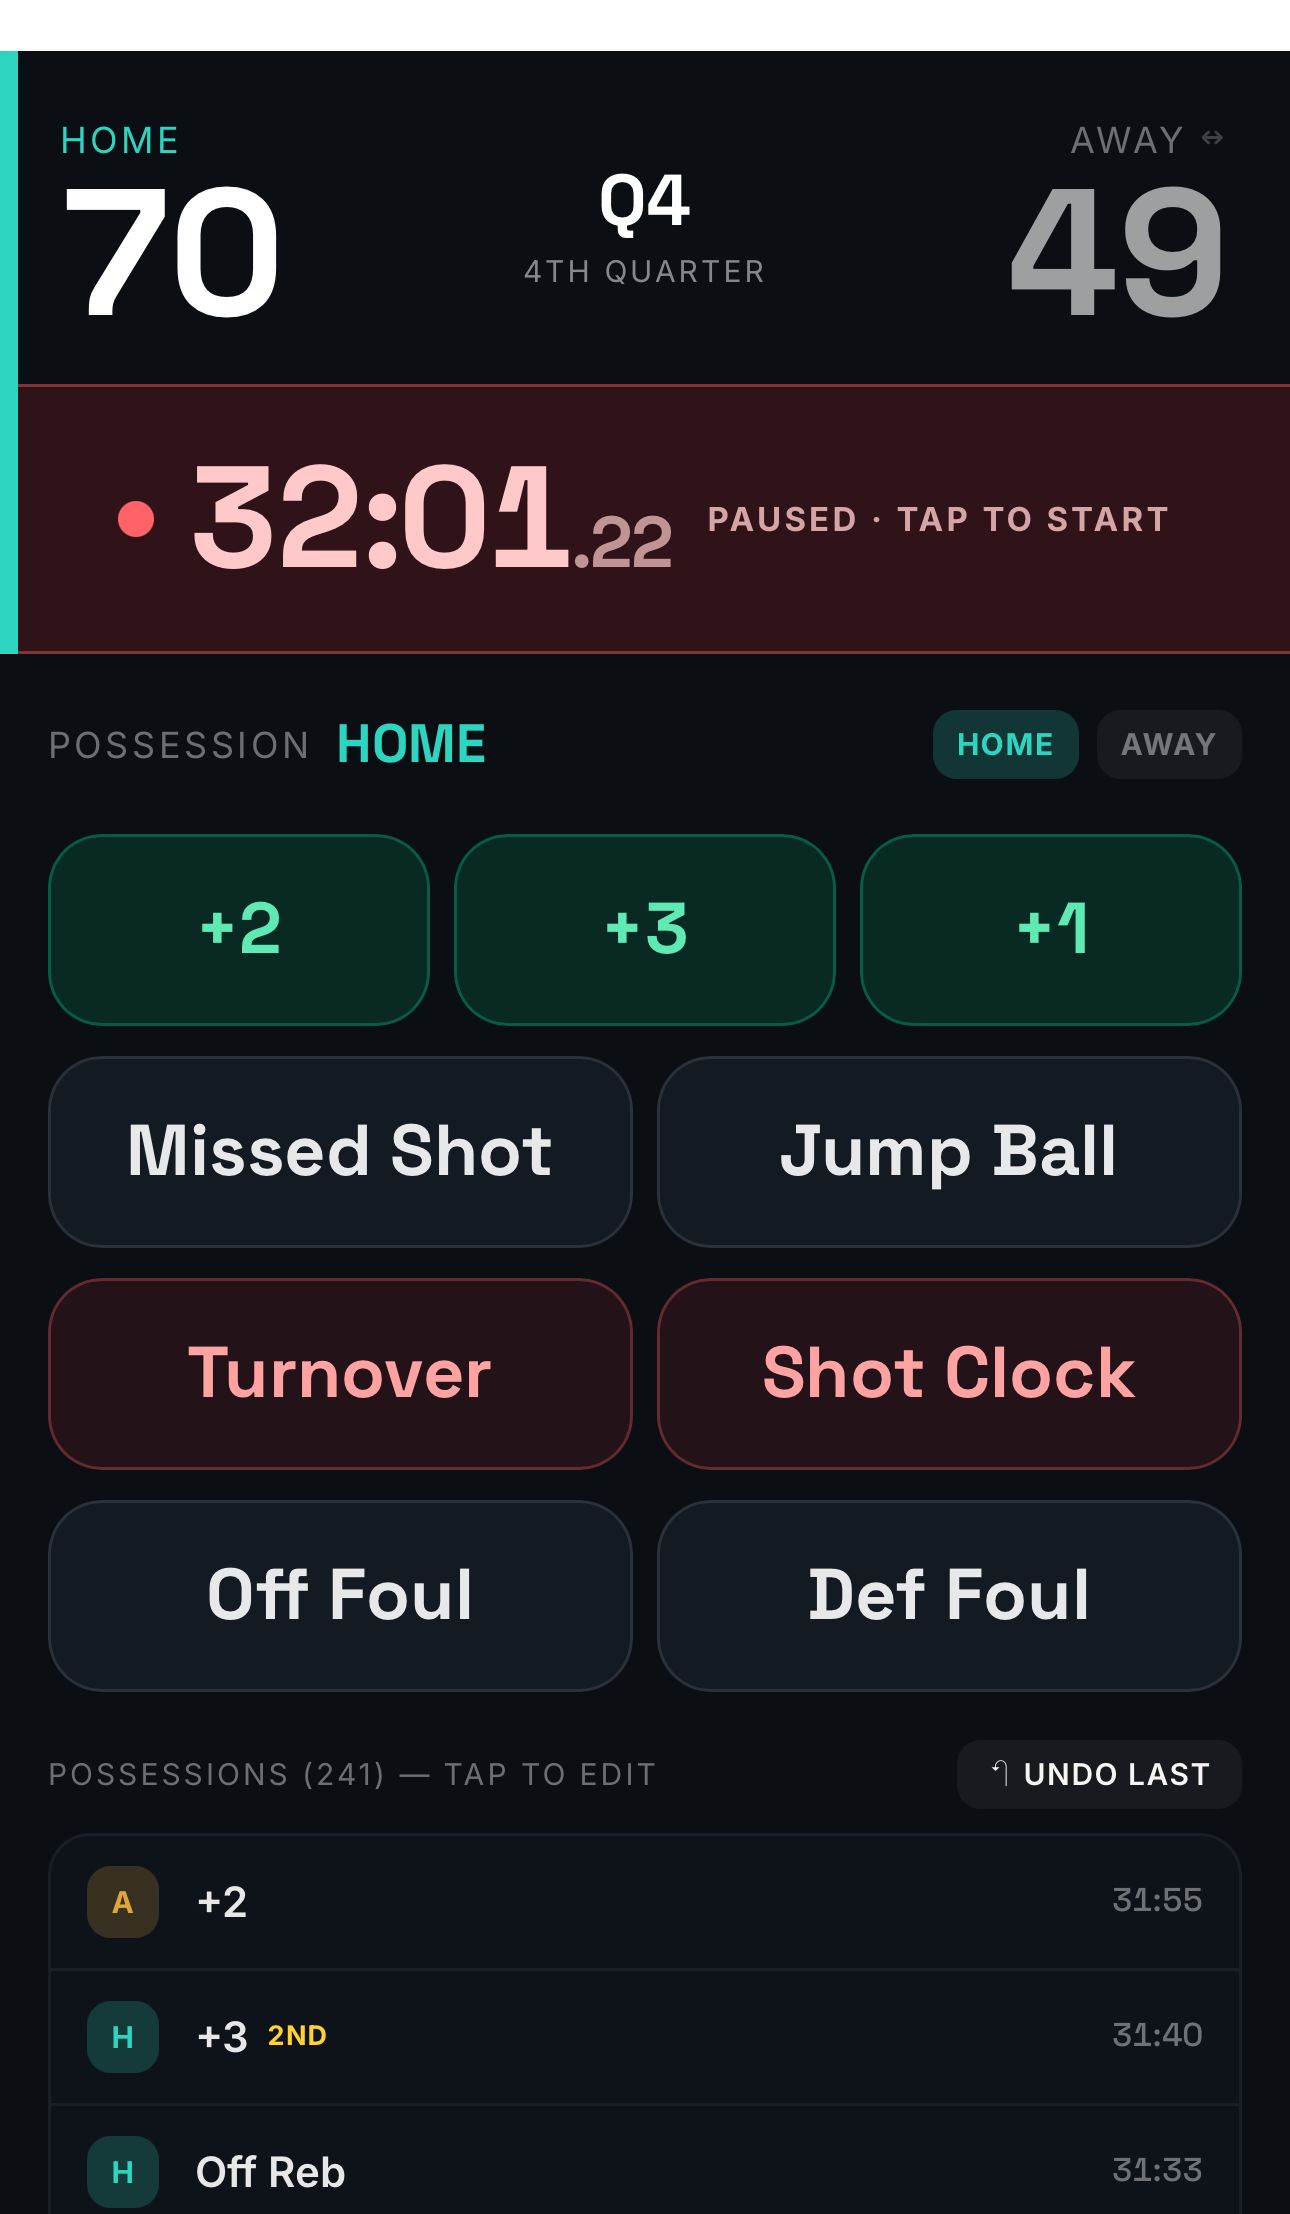
Big tap targets. Possession toggle. Every event logged with the game clock. And because high school gyms are where WiFi goes to die, the data persists locally — no connection required until the game is over.
Problem two: presentation
The paper sheet had been trying to be two things at once: the capture tool and the report. It was bad at both.
Now the report is its own product. After the game, I export the raw event log from the tracker and paste it into Claude Code — on my phone — where a skill turns it into a finished HTML report on a locked design: scoreboard, team totals, shot charts, a momentum chart, and the possession-by-possession flow that started as margin scrawl.
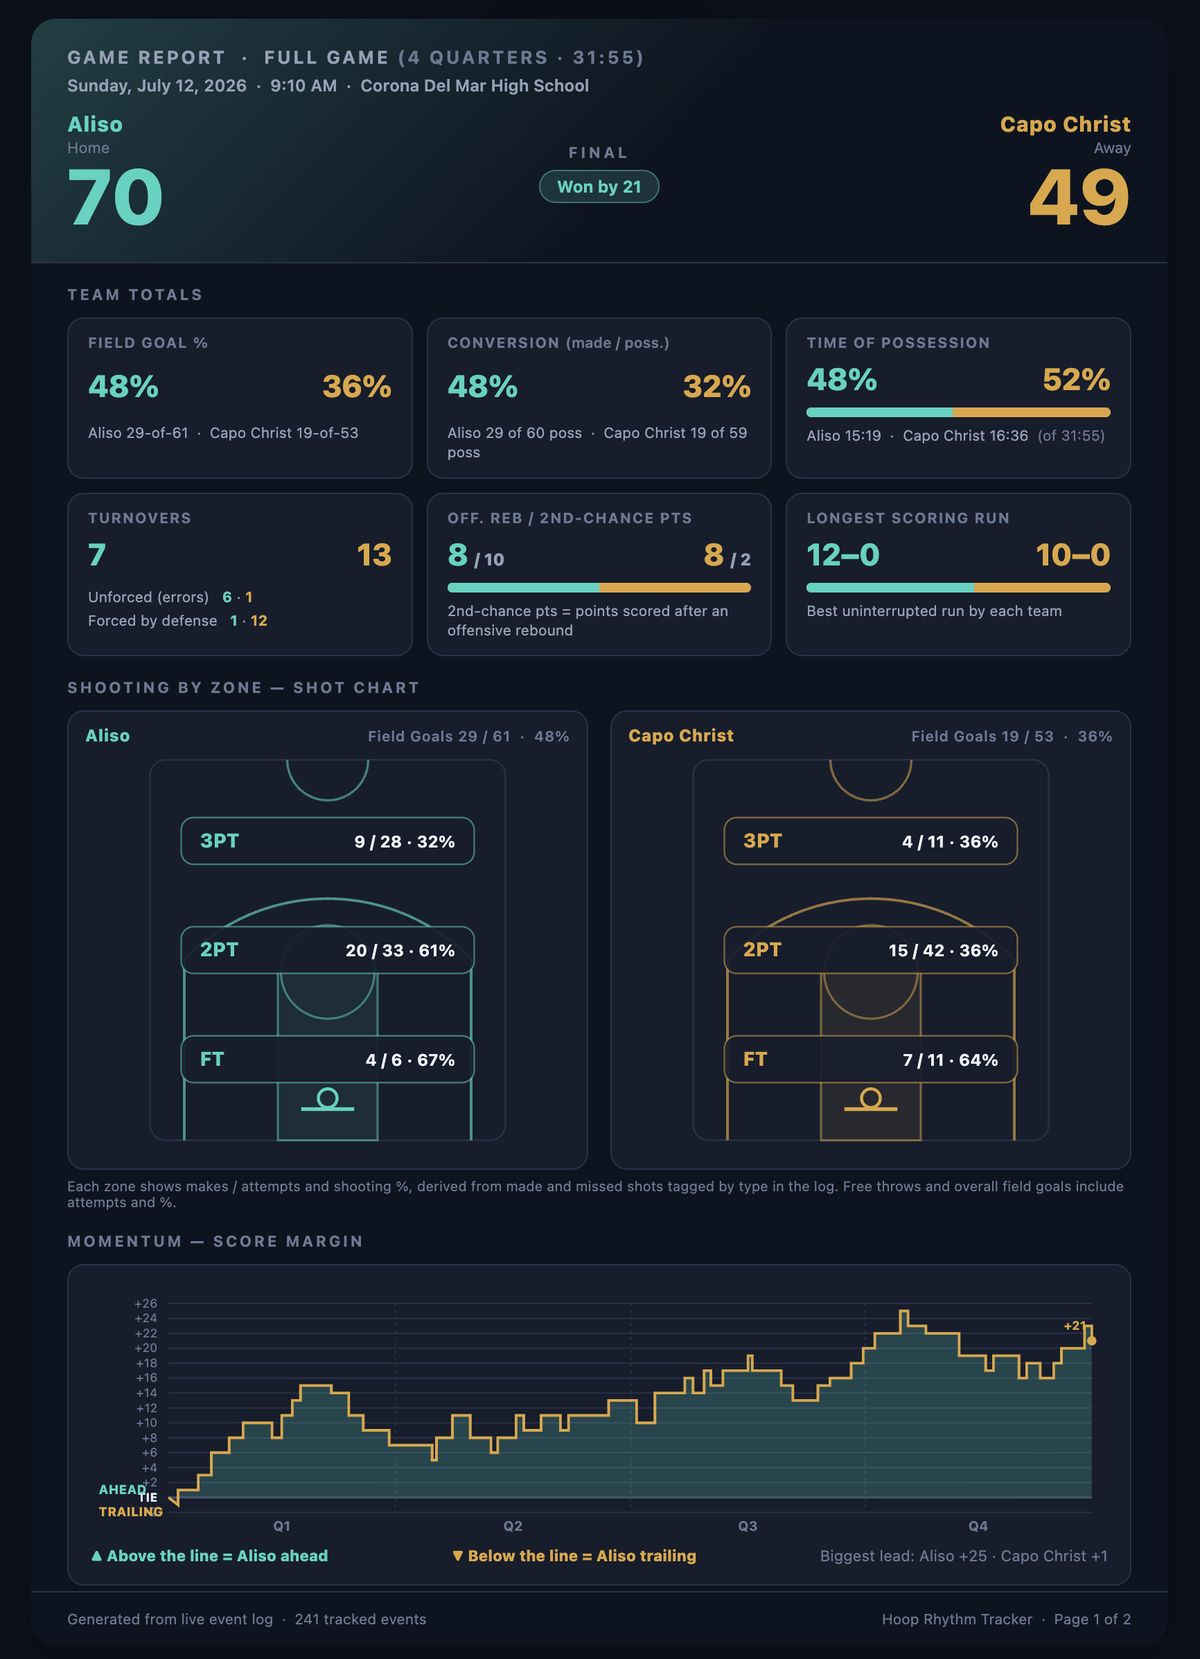
Push it to GitHub, Vercel deploys, and the coaches have a link minutes after the final buzzer. The only thing that slows me down is finding a signal on the way out of the gym.
See the live game reports here — the tracker app is linked from that page too.
The gap I left on purpose
Yes, the workflow has manual steps. Export, paste, push. That's deliberate.
It made no sense to build a backend and automate the pipeline before knowing whether coaches would even care. Every hour spent on infrastructure is an hour not spent learning whether the thing matters. Build just enough to find out.
Where it stands
Four games so far, all in summer season — the perfect low-stakes window before real games count. The coaches are finding it useful, and they keep asking for the report.
A few more games of testing. If it sticks, the next step is closing that workflow gap — and now it's a gap I know precisely, not one I'd be guessing at.
That's the whole point of prototyping: make the smallest real thing, put it in front of the people it's for, and let what happens next tell you what to build.